Drug Use, Abuse & Addiction Statistics, Trends & Data (2023 Update)
Humans and drugs have a long and complicated history. People have been using different sorts of drugs for centuries, be it for medical or recreational reasons, but only recently, the problem of drug addiction has reached epidemic levels across the globe.
Our team has collectively spent hundreds of hours working on the current drug use and abuse statistics to provide you with a comprehensive report on the current stats and trends among drug users.
The report covers a variety of drug-related issues, such as illicit substance abuse and overdose rates, emergency room data, prevention and treatment programs, and other research findings.
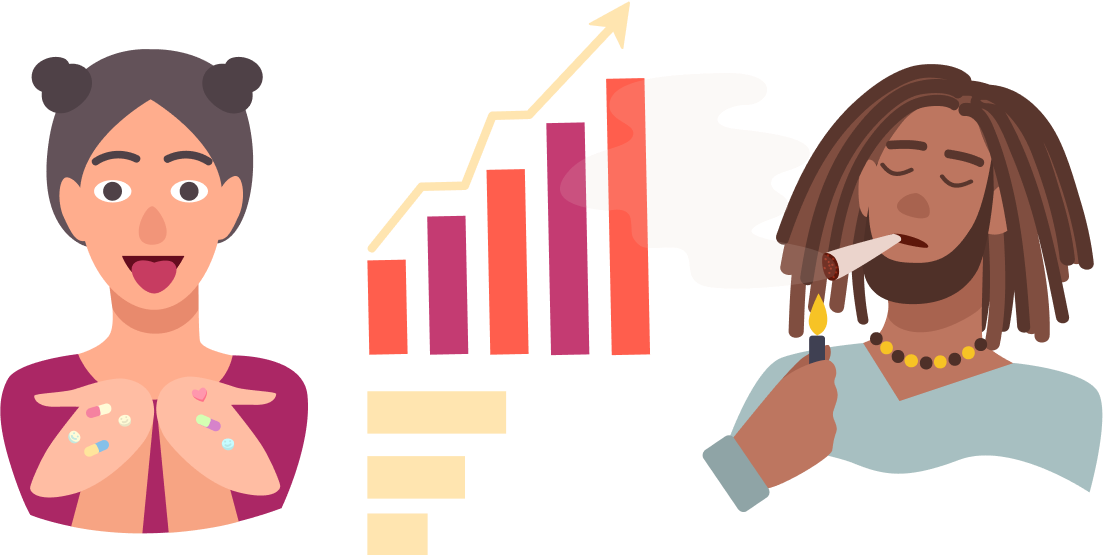
Illegal and Legal Drug Global Overview
Global Use of Illegal and Legal Drug Types
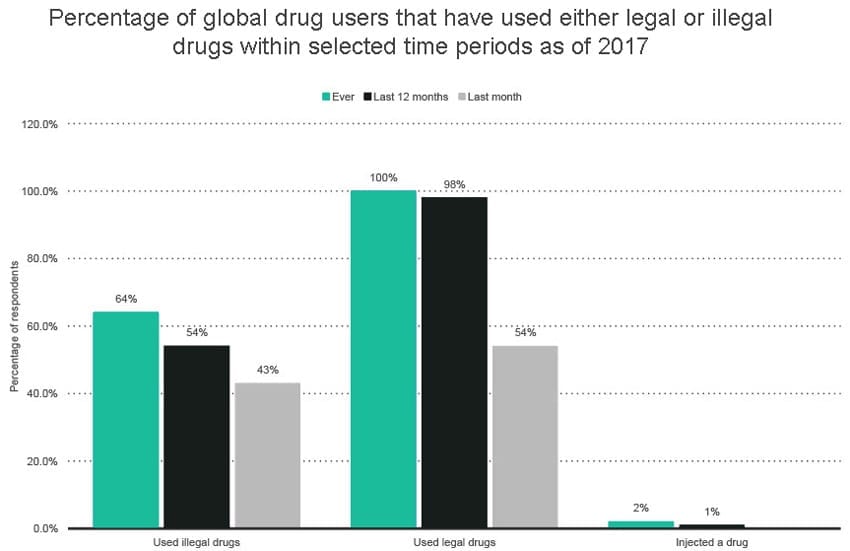
- The use of illegal drugs affects 64% of people, which is more than half of the global population. These results are attributed to people who claimed they have used an illegal drug at least once. (Global Drug Survey ID 7468184, 2017)
- 54% of respondents have used an illegal drug in the last 12 months. 43% of respondents admitted having used illegal drugs in the last month. (Global Drug Survey ID 7468184, 2017)
- Injection is the least often used method of using drugs. Only 2% of drug users have injected a drug once in their lifetime, while 1% did it in the last 12 months. (Global Drug Survey ID 7468184, 2017)
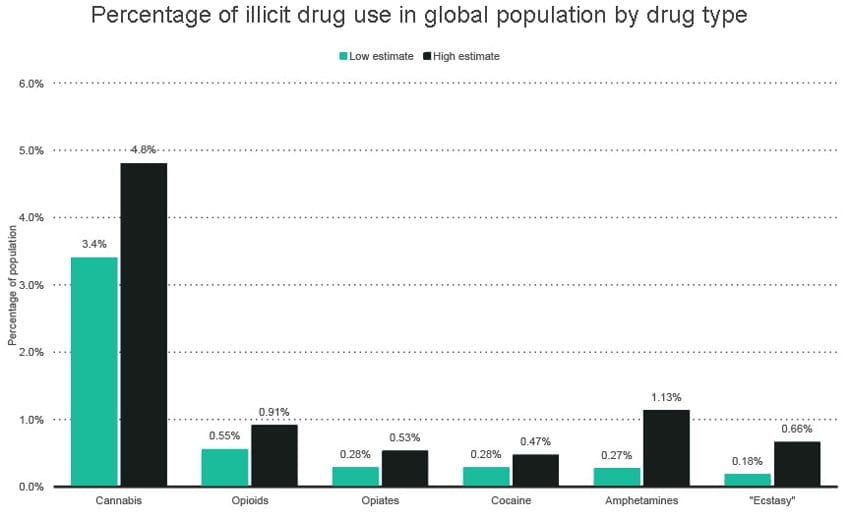
- Cannabis is the most popular illicit drug among all drug users. It is estimated that between 3.4% and 4.8% of the global population consumes cannabis. (UNODC ID 443460, 2017)
- Opioids score the second place, with 0.55% to 0.91% of the global population using opioid-based drugs. UNODC ID 443460, 2017)
- Between 0.28% and 0.53% of the global population consumes opiates, which makes them the third-most often consumed illicit drug in the world. (UNODC ID 443460, 2017)
- Cocaine is almost as popular as opiates (0.28% to 0.47% global users). It is estimated that stimulants, such as cocaine, amphetamines, and ecstasy are used by as much as 1.13% of the global population. (UNODC ID 443460, 2017)
Illegal Drug Use – Global Prevalence
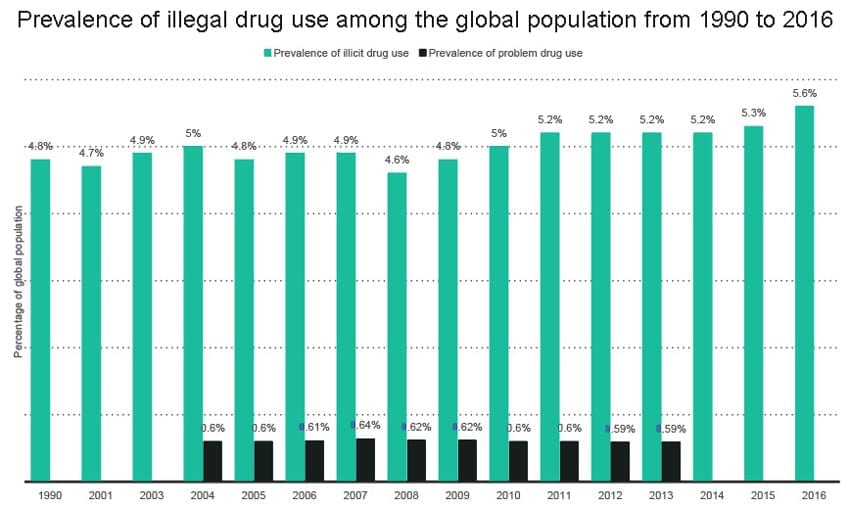
- The percentage of the global population using illegal drugs increased by 0.8% between 1990 and 2016. As the graph suggests, it was a slightly sinusoidal tendency. (UNODC ID 2724690, 2017)
- The greatest increase in global drug users was recorded between 2008 and 2016, from 4.6% (less than in 1990) to 5.2%. (UNODC ID 2724690, 2017)
- From 2004 to 2013, about 0.6% of the global population experienced problems with drug use. (UNODC ID 2724690, 2017)
- The lowest percentage of people using illicit drugs was recorded in 2008 (4.6%), which is also when the drug use problem in global population peaked. (UNODC ID 2724690, 2017)
Global Lifetime Drug Use of Select Types of Drugs
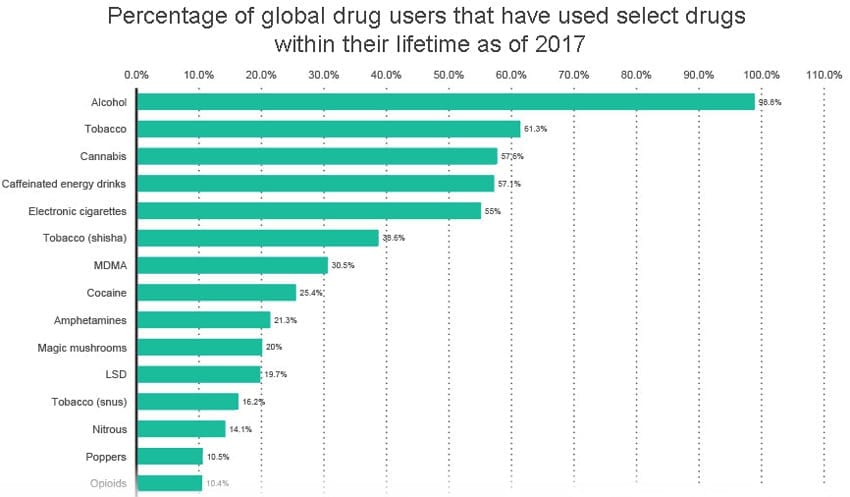
- 8% of global drug users have used alcohol at least once in their lifetime. Alcohol statistics are crushing other substances when we consider how many people are in the world. (Global Drug Survey ID 746239, 2017)
- Global Drug Abuse Survey shows that the majority of global population uses, or have used, Tobacco (61.3%) (Global Drug Survey ID 746239, 2017)
- Interestingly, there is one illicit drug that scores the third place on the list. 3% of global drug users have admittedly used cannabis within their lifetime. (Global Drug Survey ID 746239, 2017)
- The sudden increase in popularity of caffeinated energy drinks has made them almost as popular as cannabis among global drug users, with only 0.5% difference. (Global Drug Survey ID 746239, 2017)
- The use of tobacco is also prevalent in other forms, with 6% of global population using shisha. Snus, which is a sniffable form of tobacco, has been used by 16.25% global drug users. (Global Drug Survey ID 746239, 2017)
- Electronic cigarettes are almost as popular as energy drinks, cannabis, and tobacco – the drug use statistics indicate that 55% of respondents admitted to have used e-cigs within their lifetime. (Global Drug Survey ID 746239, 2017)
- Almost one-third of global population have used stimulant drugs within their lifetime. The most popular drug in this category is MDMA (30.5%), followed by cocaine (25.4%), and amphetamines (21.3%). (Global Drug Survey ID 746239, 2017)
- About one-fifth of global drug users have consumed psychedelic drugs such as magic mushrooms (20%) or LSD (19.7%). (Global Drug Survey ID 746239, 2017)
- Opioids close the list, with 4% of global drug users admitting to have used opioid-based drugs within their lifetime.(Global Drug Survey ID 746239, 2017)
Global Drug Users Seeking Emergency Medical Treatment For Select Drug Use
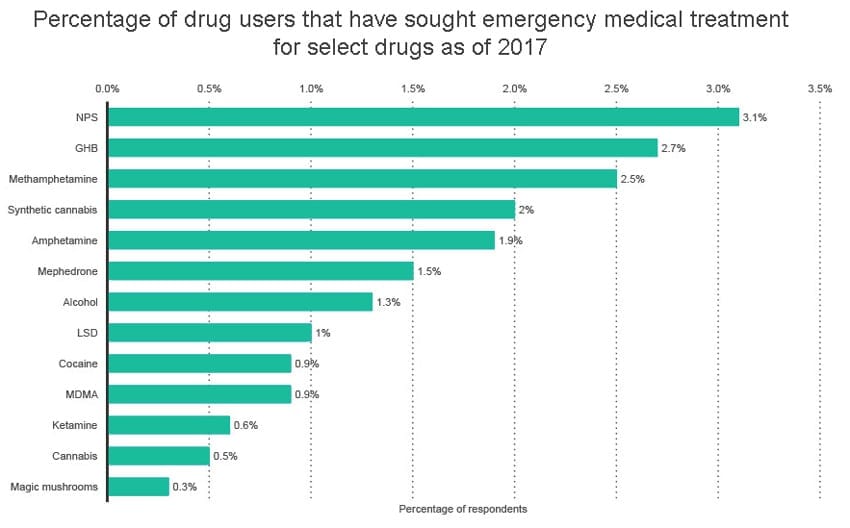
- Drug statistics are merciless for NPS, the so-called New Psychoactive Substances, also referred to as the “legal high.” 1% of drug users who have taken NPS have sought emergency treatment. (Global Drug Survey ID 748304, 2017)
- GHB or Gamma Hydroxybutyrate scored the second place among the most dangerous drugs, with 7% of drug users seeking emergency treatment after taking the substance. (Global Drug Survey ID 748304, 2017)
- Methamphetamine has a 2.5% rate of emergency medical treatment requests among drug users. It’s 0.6% lower than in the case of amphetamine (1.9%) and 1% lower than mephedrone. (Global Drug Survey ID 748304, 2017)
- 2% of synthetic cannabis users ask for emergency treatment after consuming the drug, which is four times more than people who use natural cannabis (0.5%) Global Drug Survey ID 748304, 2017)
- Alcohol is the only legal drug on the list with a noticeable rate of emergency treatment requests. 3% of alcohol users have sought such help after intoxication. (Global Drug Survey ID 748304, 2017)
- Drugs like cannabis, LSD, cocaine, MDMA, ketamine, and magic mushrooms show the lowest percentage of users asking for emergency medical aid, ranging from 0.3% (magic mushrooms) to 1% (LSD). (Global Drug Survey ID 748304, 2017)
Prevalence of Drug Use in the U.S.
Number of People in the U.S. Who Used Selected Illicit Drugs in Their Lifetime (in 1,000)
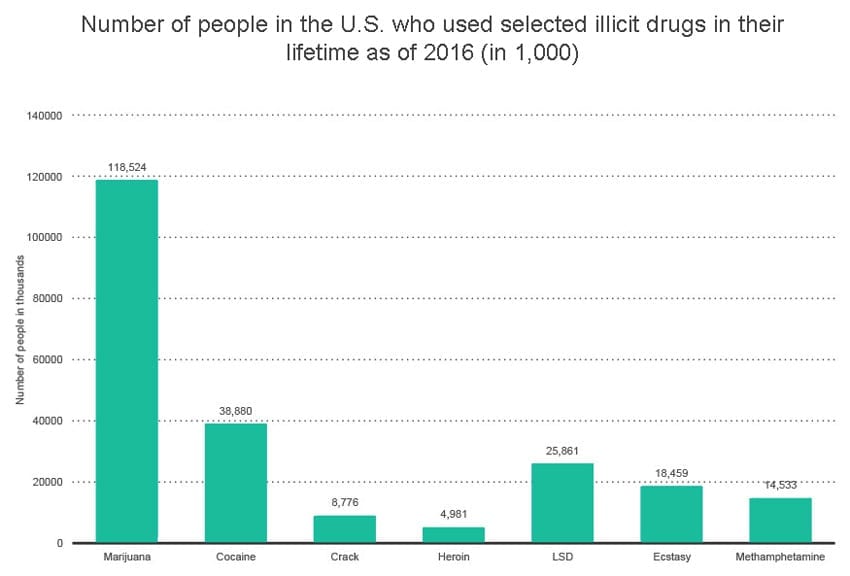
- 118,524,000 Americans admitted to have used marijuana within their lifetime, which makes it the most commonly used illicit drug in the U.S. (SAMHSA, RTI International ID 61118, 2017)
- Cocaine is the second-most popular drug among Americans, with 38,880,000 people admitting to have used the drug within their lifetime. (SAMHSA, RTI International ID 61118, 2017)
- Heroin is 2 times less popular than crack, and almost 24 times less popular than marijuana. Only 4,981,000 American residents have used heroin at least once. (SAMHSA, RTI International ID 61118, 2017)
Number of People in the U.S. Who Used Selected Illicit Drugs in the Past Year (in 1,000)
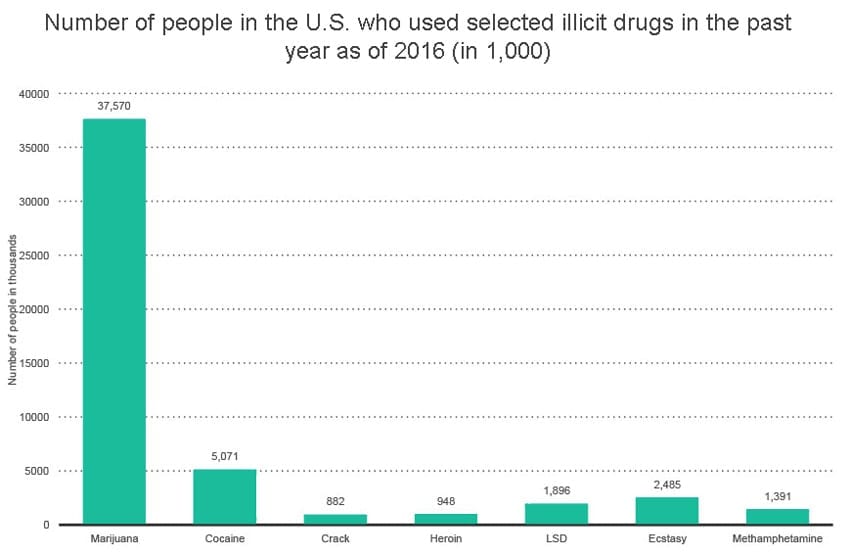
- Marijuana is used by an overwhelming majority of the U.S. drug users. 37,570,000 Americans admitted to have used marijuana in the past year. (SAMHSA: RTI International ID 611152, 2017)
- Although much less used than marijuana, cocaine is still popular in the U.S.. 5,071,000 people reported that they used cocaine in the past year. (SAMHSA: RTI International ID 611152, 2017)
- Crack and heroin users are in the clear minority. Only 882,000 people used crack in the past year, while the number of those who consumed heroin in the same period accounts to 940,000. (SAMHSA: RTI International ID 611152, 2017)
Recreational Drug Use Statistics
Number of People in the U.S. Who Used Marijuana in Their Lifetime from 2009 to 2016 (in 1,000)
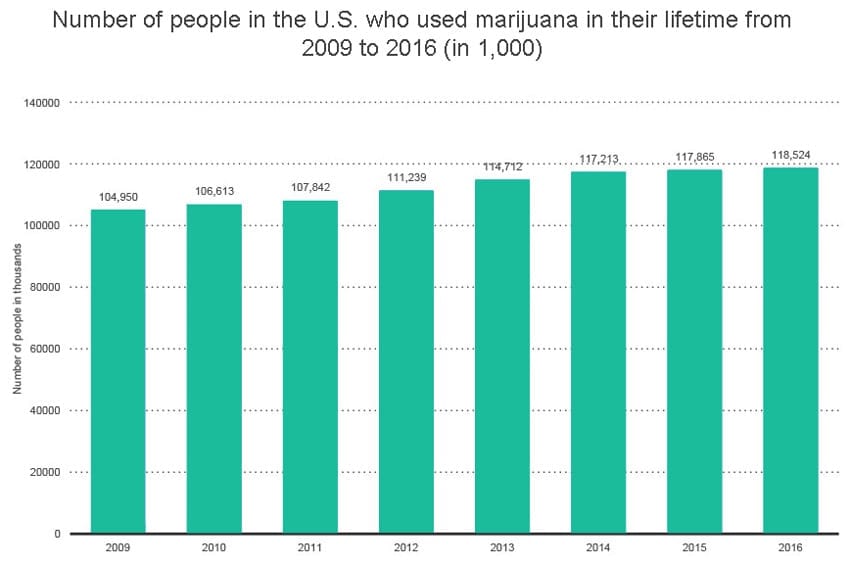
- Since its discovery thousands of years ago, marijuana has experienced a classical curse-and-redemption story, but in recent years, we can observe a significant increase in marijuana use in the U.S. The number of people who have used marijuana at least once in their lifetime increased by 13,574,000. (SAMHSA; RTI International ID 61168)
- The highest increase in marijuana use was recorded between 2012 and 2016. In 2012, 111,239,000 Americans reported to have used marijuana within their lifetime. In 2016, this number rose to 118,529,000 people. (SAMHSA; RTI International ID 61168)
- There was no single decrease in marijuana use between 2009 and 2016. (SAMHSA; RTI International ID 61168)
Related:
- What Is Delta 8 THC? Everything You Need To Know About This Cannabinoid
- Can You Get Addicted to CBD Oil?
Number of People in the U.S. Who Used Ecstasy (MDMA) in Their Lifetime from 2009 to 2016 (in 1,000)
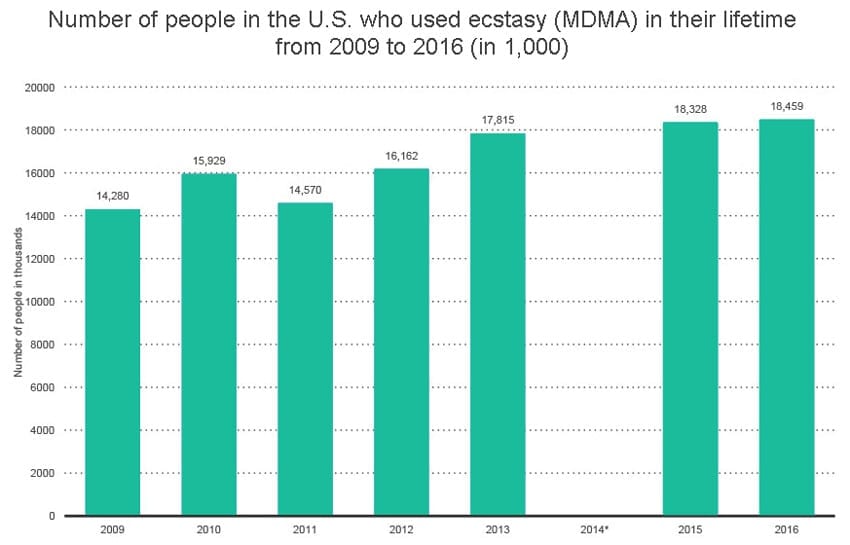
- Ecstasy is one of the most popular drugs used among young adults in clubs and at music festivals. In 2009, 14,280,000 people admitted they have used ecstasy within their lifetime according to responses from people 12 years and older. (SAMHSA; RTI International ID 61179)
- 18,459,000 people in the U.S. reported to have taken ecstasy at least once in their lifetime in 2016, which is 4,269,000 more than in 2009. (SAMHSA; RTI International ID 61179)
- There was only one decrease in ecstasy use since 2009. In 2011, the number of people who claimed to have used ecstasy dropped from 15,929,000 to 14,570,000, which is only 290,000 more than in 2009.(SAMHSA; RTI International ID 61179)
- The number of people in the US who have used ecstasy within their lifetime couldn’t be compared to other years due to the changes in methodology. (SAMHSA; RTI International ID 61179)
Number of People in the U.S. Who Used Cocaine in Their Lifetime from 2009 to 2016 (in 1,000)
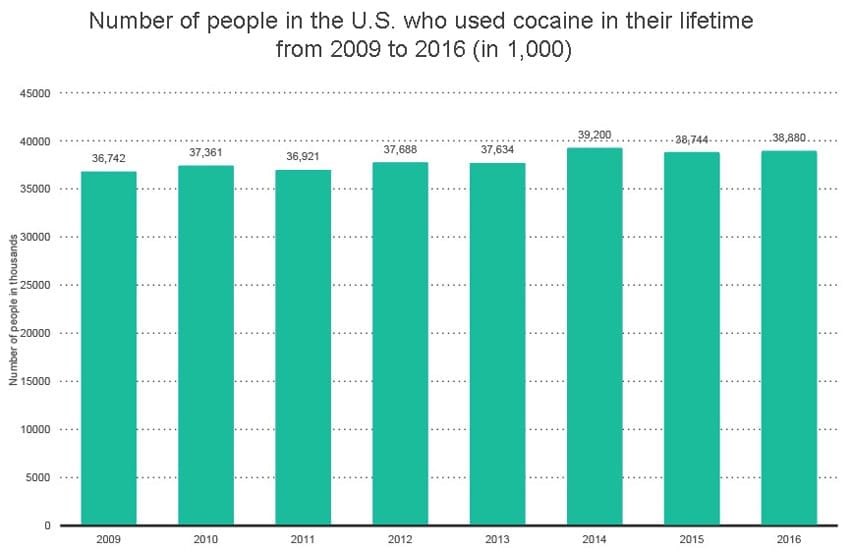
- The popularity of cocaine among people in the U.S. maintained a steady increase between 2009 and 2016. The number of one-time users increased only by 2,138,000, which is a relatively slow pace in comparison to the popularity of marijuana in these years, which use increased by 7,290,000 people. (SAMHSA, RTI International ID 611637)
- The use of cocaine among people in the U.S. peaked in 2014, with 39,200,000 people claiming they have used the drug at least once in their lifetime. (SAMHSA, RTI International ID 611637)
- According to 2016 statistics, 38,880,000 of people in the U.S. have used cocaine, which is over twice as many users as in the case of ecstasy (MDMA). (SAMHSA, RTI International ID 611637)
Number of People in the U.S. Who Used Crack in Their Lifetime from 2009 to 2016 (in 1,000)
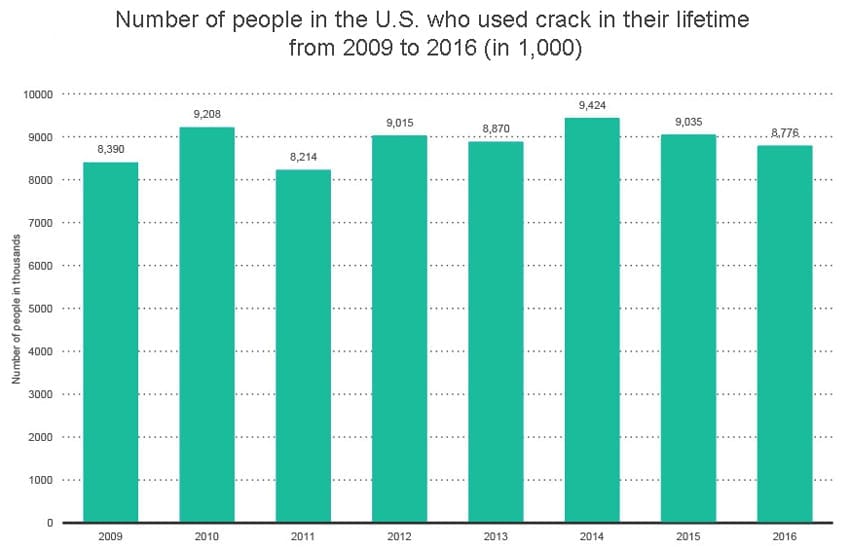
- Crack is one of the most addictive recreational drugs in the world. Fortunately, it’s not as popular in the U.S. as other, less harmful drugs. The use of crack noted a very low increase from 2009 to 2016. Only 386,000 more people reported to have the drug in their lifetime in comparison to 2009. (SAMHSA, RTI International)
- The use of crack in the U.S. peaked in 2014, reaching 9,424,000 one-time users. (SAMHSA, RTI International)
- The popularity of crack in the U.S. is a sinusoidal trend, but we can observe a steady decrease in its use since 2014. The number of people who admitted to have used crack in their lifetime dropped by 648,000 in two years. (SAMHSA, RTI International)
Number of People in the U.S. Who Used Methamphetamine in the Lifetime from 2009 to 2016 (in 1,000)
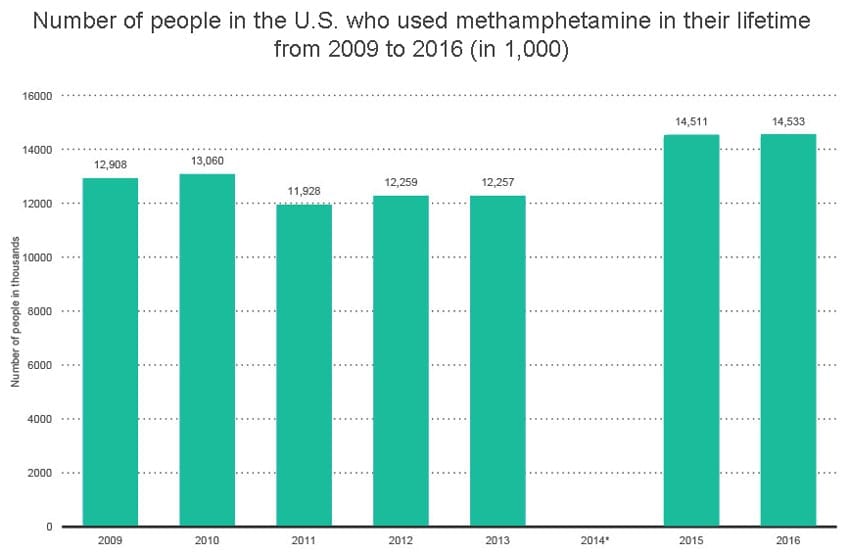
12,908,000 people in the U.S. admitted to have used methamphetamine in their lifetime in 2009. (SAMHSA, RTI International ID 611672)
- In 2010, the number of one-time methamphetamine users dropped to 13,060,000. (SAMHSA, RTI International ID 611672)
- There was a decrease in the number of people who have used amphetamine within their lifetime between 2010 and 2011. The number dropped by 1,132,000. (SAMHSA, RTI International ID 611672)
- Since 2011, we can observe a steady rise in the use of methamphetamine by people 12 years and older. In 2015, 14,533,000 people in the U.S. answered that they have tried methamphetamine at least once in their lifetime. (SAMHSA, RTI International ID 611672)
- The 2014 results were not comparable due to methodological changes. (SAMHSA, RTI International ID 611672)
Number of People in the U.S. Who Used Heroin in Their Lifetime from 2009 to 2016 (in 1,000)
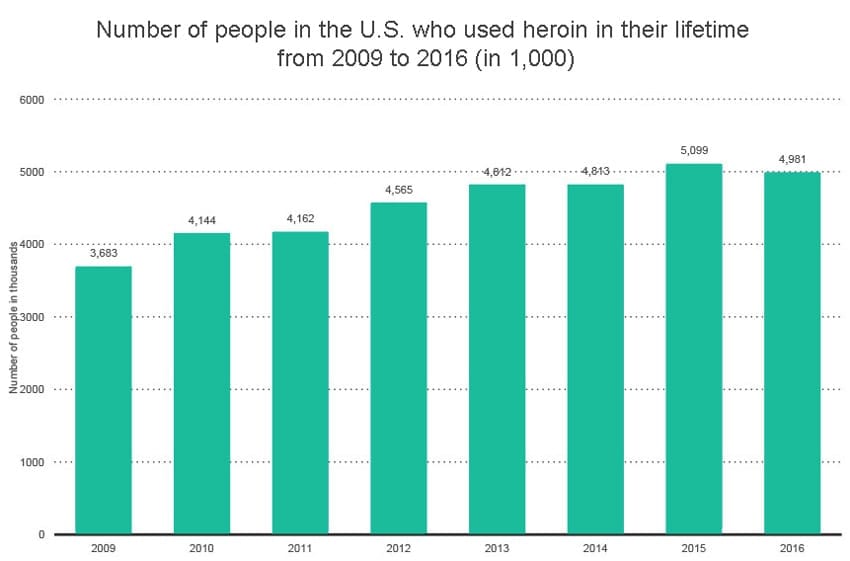
- 3,683,000 people in the U.S. have admittedly used heroin within their lifetime according to a 2009 report. (SAMHSA, RTI International ID 611657)
- The number of one-time heroin users increased by 1,416,000 between 2009 and 2015. (SAMHSA, RTI International ID 611657)
- 2016 was the first time when heroin noted a slight decrease in use, from 5,009,000 people in 2015 to 4,981,000. (SAMHSA, RTI International ID 611657)
Heroin Dependence or Abuse Among Individuals during the past year from 2002 to 2016 (in 1,000)
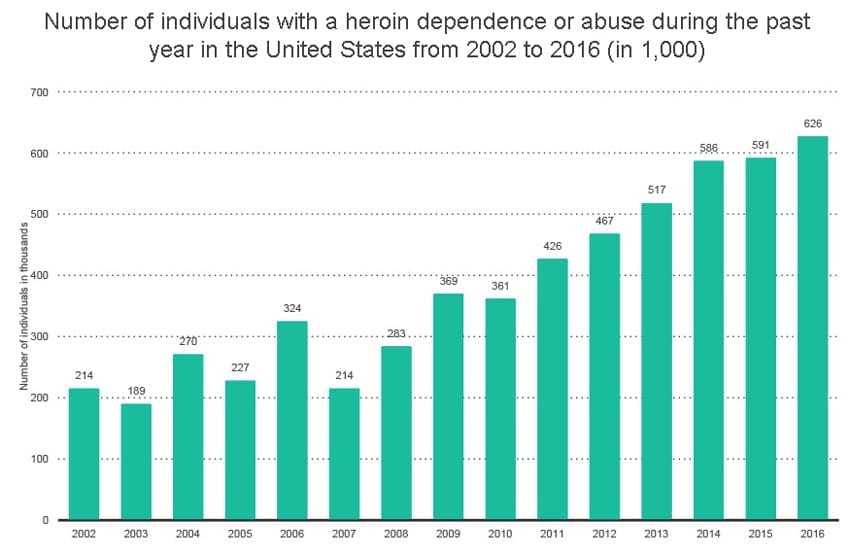
- Heroin abuse is a fast-growing problem in the U.S., with 626,000 people who reported to have abused heroin in the past year. (SAMHSA ID 476276)
- We could see a significant increase the number of individuals abusing heroin in 2002 in comparison to 2016. In 2002, 214,000 people in the U.S. struggled with heroin addiction or abuse, which is 412,000 less than in 2016. (SAMHSA ID 476276)
- The lowest rates of heroin abuse were noted in 2002 and 2007, when 214,000 individuals reported to have been dependent on heroin in the past year. (SAMHSA ID 476276
- The number of people addicted to heroin has almost doubled between 2007 and 2011, with 212,000 more victims of the drug dependence. (SAMHSA ID 476276)
Substance Use Among Adults in the United States by Any Mental Illness
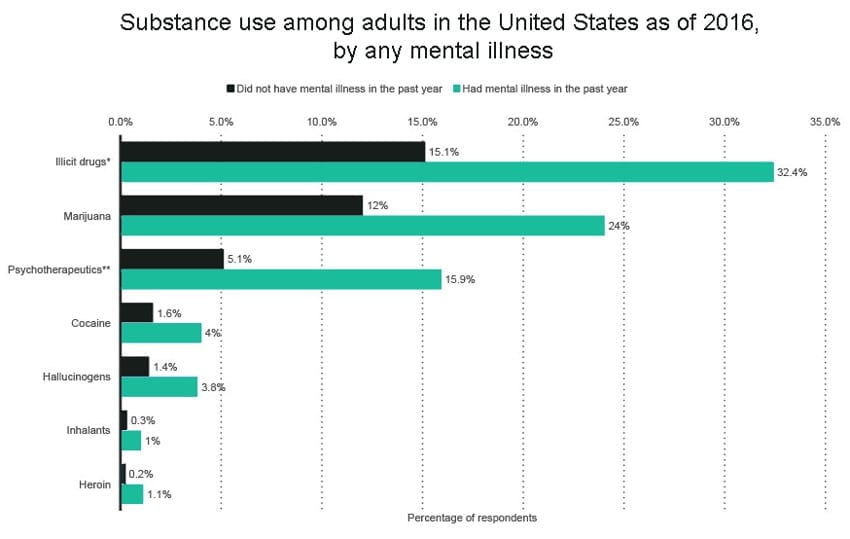
- 4% of respondents who had a mental illness in the past year used illicit drugs, which is almost twice as much as those who used them only for recreational purposes (15.1%). (SAMHSA; NSDUH ID 252470)
- Over one-fifth of respondents who had a mental illness in the past year (24%) used marijuana, with half as much non-affected users (12%). (SAMHSA; NSDUH ID 252470)
- Psychotherapeutics scored the third place with 15.9% users who struggled with a mental illness in the past year. (SAMHSA; NSDUH ID 252470)
Prescription Drug Abuse Statistics
Prescription Drug Sales in the US
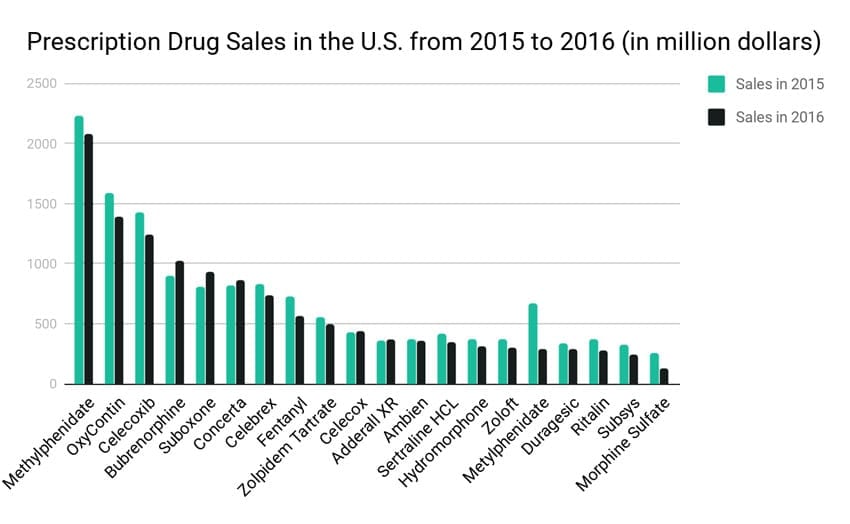
- Most drugs noted a decrease in sales in the 2015-2016 period. Methylphenidate HCl, the most popular prescription drug in the U.S., reached 2.073 billion dollars in sales in 2016, which is 159 million dollars less than in the past year. (The U.S. Centers for Disease Control and Prevention (CDC)’s National Center for Health Statistics)
- Oxycontin is the second-most often sold prescription drug, with 1.39 billion dollars in sales in 2016. (The U.S. Centers for Disease Control and Prevention (CDC)’s National Center for Health Statistics)
- Celecoxib (1.246 billion) and Buprenorphine (1.026 billion) closed the list of prescription drugs that breached the billion-dollar threshold in 2016. (The U.S. Centers for Disease Control and Prevention (CDC)’s National Center for Health Statistics)
- Morphine Sulfate was the least popular prescription drug with only 132 million dollars in sales as of 2016. (The U.S. Centers for Disease Control and Prevention (CDC)’s National Center for Health Statistics)
Opioid Overdose Deaths in the U.S. from 1999 to 2016, by Drug Type (per 100,000 population)
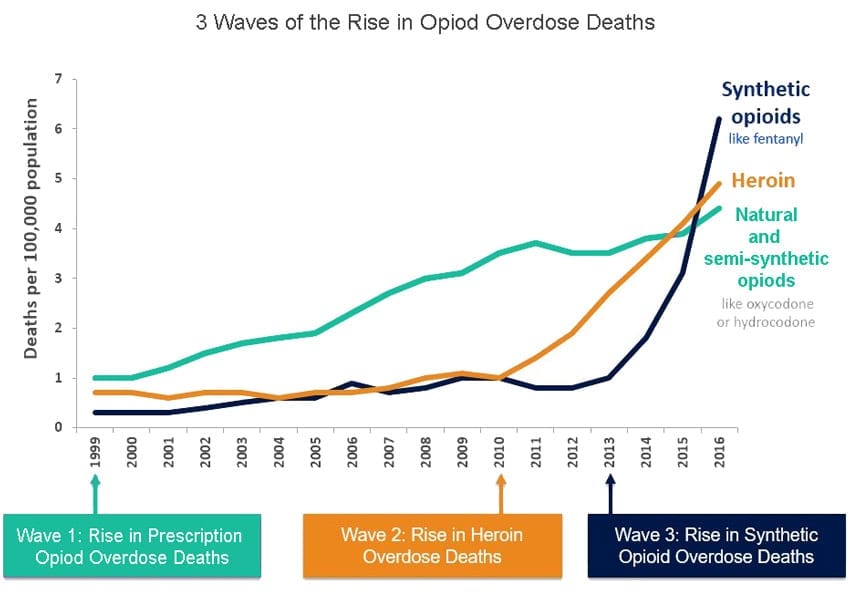
- More than 350,000 people died from an opioid overdose from 1999 to 2016, including prescription and illicit opioids (National Vital Statistics System Mortality File)
- The first wave of opioid overdose deaths began in the 1990s, with overdose deaths that involved prescription opioids. Almost 400,000 people died from prescription opioids in the 1999-2016 period. (National Vital Statistics System Mortality File)
- The second wave was triggered in 2010, with rapid increases in overdose deaths among heroin users. More than 350,000 people died from heroin overdose from 2010 to 2016. (National Vital Statistics System Mortality File)
- The third wave of opioid overdose deaths began in 2013, with significant increases in overdose deaths involving mostly illicitly-manufactured fentanyl (IMF). More than 500,000 people died from synthetic opioid overdoses between 2013 and 2016. (National Vital Statistics System Mortality File)
U.S. Drug Statistics Regarding the Use of Depressants and Antidepressants among Teens as of 2018
- Depressants, opioids, and antidepressants make up to 45% overdose deaths, which is more than heroin, cocaine, methamphetamine, and amphetamines combined(39%). (US Department of Health & Human Services)
- Until recently, African-American neighborhoods were the most prevalent territories when it comes to the use of depressants and antidepressants. However, they have been now overtaken by white rural communities. (US Department of Health & Human Services)
- 2 million users over the age of 12 have misused a prescription tranquilizer in their lifetime– 4 times more than prescription sedatives. (US Department of Health & Human Services)
Teen Drug Use

Lifetime Prevalence of Drug Use Within Grades 8, 10 and 12 in the U.S. Combined from 2004 to 2017
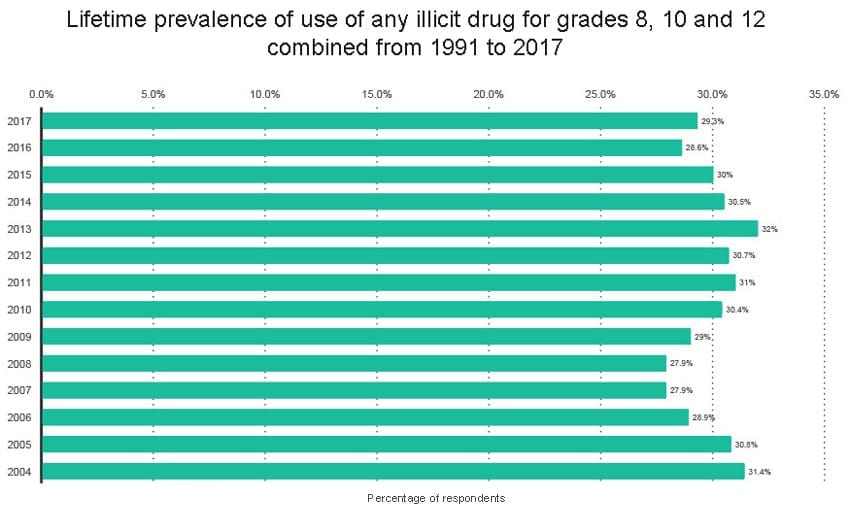
- 4% of U.S. teens admitted to having used an illicit drug within their lifetime in 2017, which is 3% less than in 2004 (36.4%) (Institute for Social Research ID 208420)
- 2013 was the only year when the lifetime prevalence of illicit drug use for grades 8, 10 and 12 combined almost reached its peak from 2004, with 36% teen one-time drug users. (Institute for Social Research ID 208420)
- The lowest rates of the lifetime prevalence of illicit drug use were noted in 2016 and 2008 (32.6%) (Institute for Social Research ID 208420)
- The number of 8, 10, and 12-graders who used an illicit drug within their lifetime noted the highest increase between 2008 and 2013, from 32.6% to 36%. (Institute for Social Research ID 208420)
U.S. High School Students Who Have Used Hallucinogenic Drugs at Least Once as of 2017, by gender and ethnicity
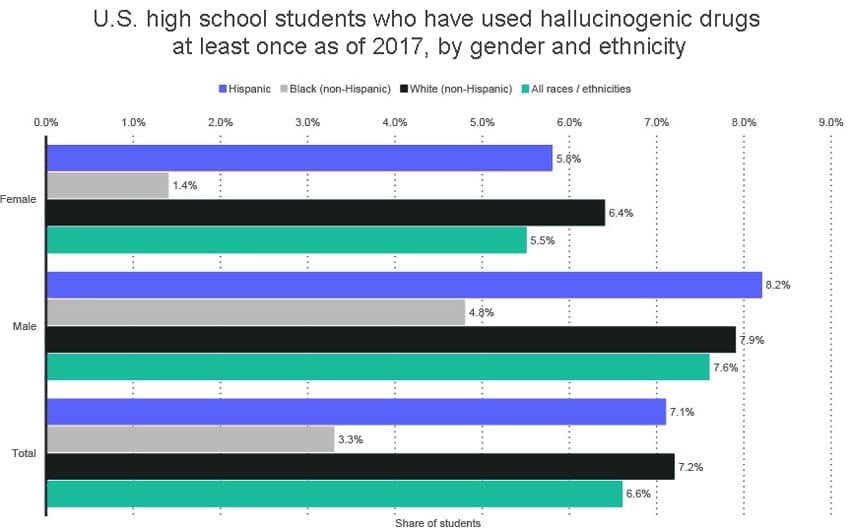
- Of all ethnicities, white (non-Hispanic) high school students are the group with the highest one-time hallucinogenic drug use rates.2% respondents admitted to have used a hallucinogenic drug at least once in their lifetime. (CDC ID 222515)
- 2% of Hispanic male students responded with a “yes” when asked if they have used a hallucinogenic drug at least once, more than Black, White, and other races/ethnicities. (CDC ID 222515)
- Of all ethnic groups, Black (non-Hispanic) high school students are the one with the lowest rate of one-time hallucinogenic drug use. Only 3.3% of respondents have used a hallucinogenic drug at least once. (CDC ID 222515)
- Female Black students are the least enthusiastic when it comes to hallucinogenic drugs, with only 1.4% of respondents admitting to have tried LSD, acid, PCP, angel dust, mescaline, or mushrooms one or more times during in their life. (CDC ID 222515)
- Male students are more likely to use hallucinogenic drugs than female users in the same age. It applies to all ethnic groups. (CDC ID 222515)
Lifetime Prevalence of Cocaine Use Within Grades 8, 10 and 12 from 2004 to 2017
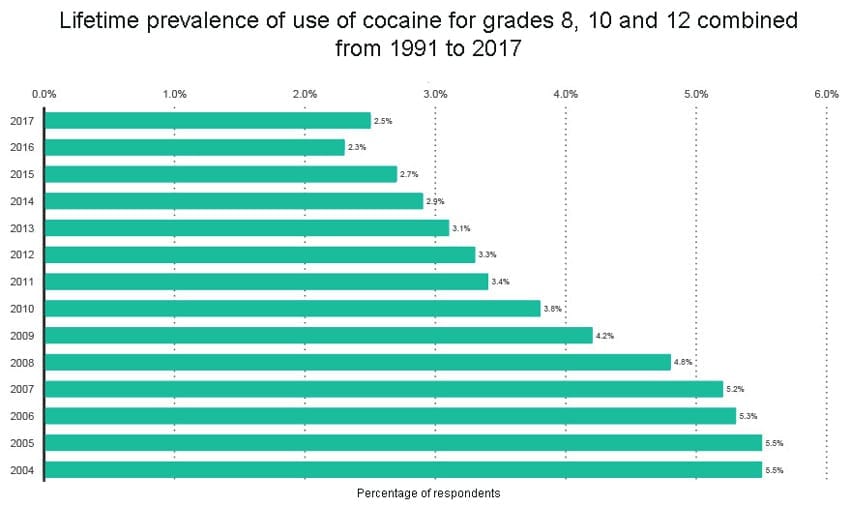
- The use of cocaine among 8- 10- and 12-grade students has been steadily decreasing since 2004.The number of students who admitted to have used cocaine one time or more in their lifetime has dropped by 3% as of 2017. (Institute for Social Research)
- 2017 drug use statistics indicate that cocaine is slowly regaining popularity. As of 2017, 5% of 8-, 10-, and 12-graders have used cocaine within their lifetime. It’s a 0.2% growth compared to the past year. (Institute for Social Research)
The sharpest decline in cocaine use among 8th-, 10th-, and 12th-grade students was noted between 2008 and 2009, when the number dropped by 0.6%. (Institute for Social Research)
Percentage of U.S. High School Students Who Have Used Cocaine at Least Once as of 2017, by Gender and Ethnicity
- Hispanic male high school students are the most prevalent group when it comes to one-time cocaine use.1% of respondents have used the drug at least once in their lifetime. (CDC ID 222514)
- Hispanic students are also the most prevalent group in one-time cocaine use in general, with 3% of the total share of students reporting to have used cocaine at least once. (CDC ID 222514)
- Only 1.2% of Black (non-Hispanic) female high school students have used cocaine within their lifetime, which makes them the least affected group among other ethnicities. (CDC ID 222514
- 5% fewer Black (non-Hispanic) female high school students have used cocaine within their lifetime than their male counterparts. (CDC ID 222514)
30-day Prevalence of Drug Use Within Grades 8, 10 and 12 in the U.S. Combined from 2004 to 2017
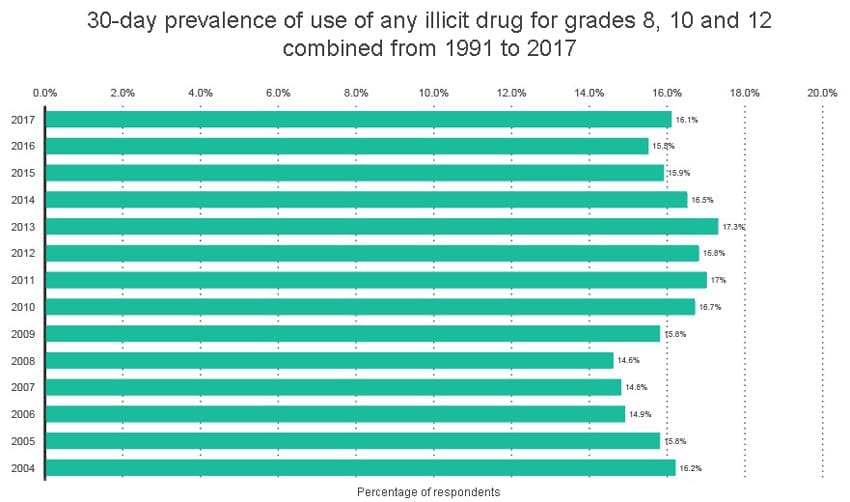
- Regular drug use is still a worrying issue in schools, with 16.1% of 8th-, 10th-, and 12th-grade students admitting to have used an illicit drug in the past 30 days. (Institute for Social Research ID 209025)
- In 2017, illicit drugs were used by almost as many students as in 2004. There is a mere 1% difference between these two years. This, in turn, indicates that schools haven’t been able to put a stop to the problem for 13 years. (Institute for Social Research ID 209025)
- In 2013, 17.3% of 8th-, 10th-, and 12th-graders answered ‘yes’ when asked if they used an illicit drug in the past 30 days, which is also when illicit drug use for the aforementioned grades was at its peak. (Institute for Social Research ID 209025)
The percentage of students claiming they have used an illicit drug in the past 30 days has never dropped below 14% of total respondents since 2004. (Institute for Social Research ID 209025)
Juvenile Arrest Rate for Drug Abuse in the United States in 2016, Sorted by State
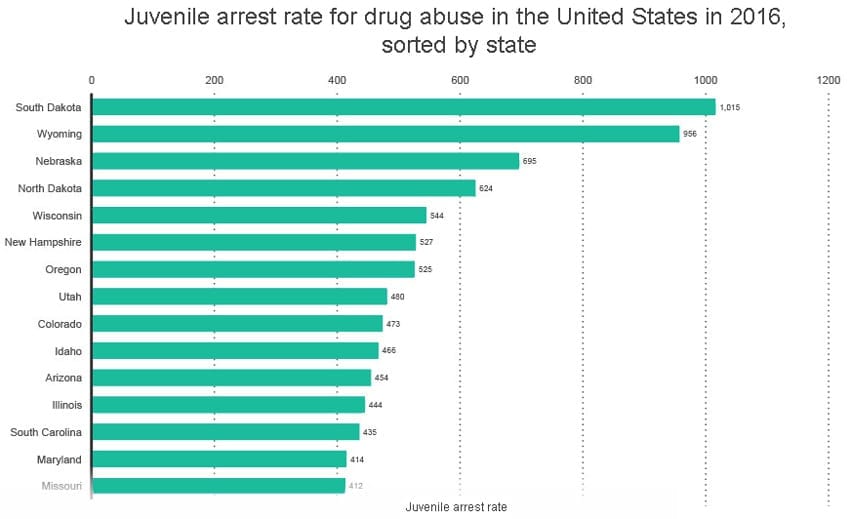
- South Dakota is the leading state when it comes to juvenile arrest rates for drug abuse. In 2016, the state’s authorities recorded 1,015 drug-related arrests. (OJJDP ID 306647)
- Wyoming is the state with the second-highest rate of juvenile arrests for drug abuse, with 966 recorded incidents. (OJJDP ID 306647)
- Nebraska, the third-most affected state in the U.S., noted 695 cases of juvenile arrest in 2016, which is 320 less than in South Dakota. (OJJDP ID 306647)
- Interestingly, the highest juvenile arrest rates for drug abuse were recorded in the most conservative states where, for example, the use of marijuana – the most prevalent drug among young users – is severely prosecuted. States that decriminalized marijuana, such as Missouri, Maryland, and North Carolina have some of the lowest juvenile arrest rates for drug abuse in the whole country. (OJJDP ID 306647)
Drug-related Deaths

Drug Overdose Death Rate in the United States in 2016, by State (per 100,000 population)
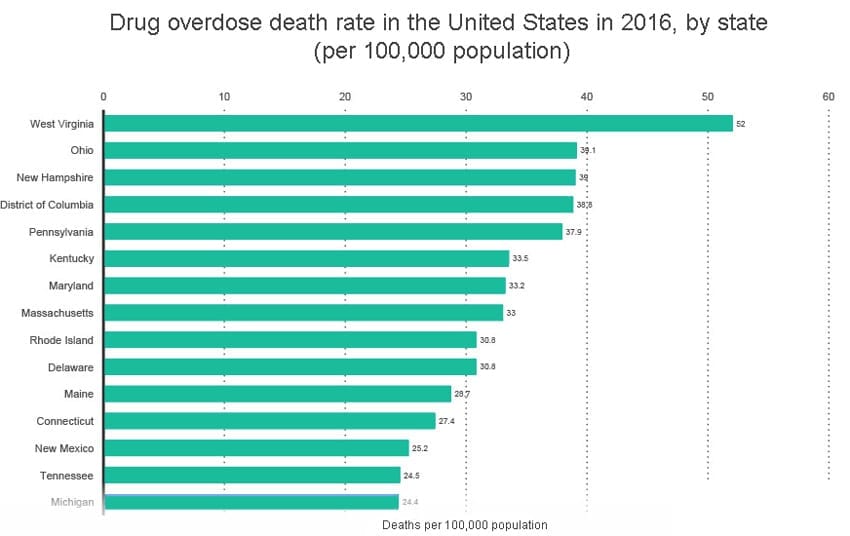
- West Virginia noted the highest drug overdose death rate in the U.S. in 2016. Per each 100,000 people, 52 individuals died from a drug overdose. (CDC ID 610864)
- The highest increase in marijuana use was recorded between 2012 and 2016. In 2012, 111,239,000 Americans reported to have used marijuana within their lifetime. In 2016, this number rose to 118,529,000 people. (SAMHSA; RTI International ID 61168)
- New Mexico has almost two times lower drug overdose death rate than West Virginia, with 25.2 deaths per 100,000. (CDC ID 610864)
Number of Drug Overdose Deaths in the U.S. in 2016, by State
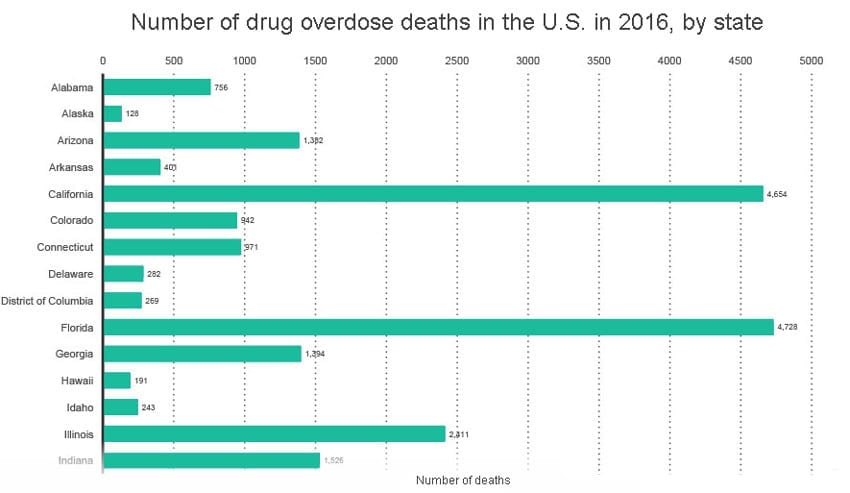
- Significant increases in drug overdose deaths were seen between 2015 and 2016 in California (4,664), Florida (4728), Illinois (2,411), Indiana (1526), and Georgia (1304). (CDC ID 610864)
- Alaska noted the lowest number of drug overdose deaths in 2016, with 125 such recorded cases. In comparison, Florida noted almost 38 times more drug overdose deaths. (CDC ID 610864)
- Aside from Alaska, there are other states that had a relatively low number of drug overdose deaths in 2016. Hawaii, Idaho, Delaware, District of Columbia, Arkansas – these are the safest places according to the chart. (CDC ID 610864)
Number of Drug Overdose Deaths in the U.S. from 1999 to 2016, by Gender
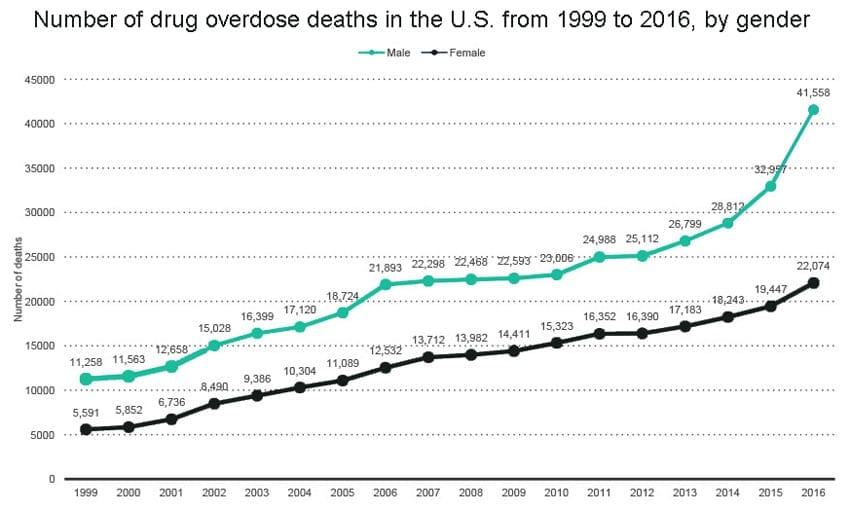
- The number of men who died from a drug overdose almost quadrupled between 1999 and 2016; it increased from 11,258 to 41,558 fatal cases. (CDC; NCHS ID 611012)
- Each year, the number of drug overdose deaths among men is almost twice as high as among women. (CDC; NCHS ID 611012)
- The most rapid increase in drug overdose deaths among men was recorded between 2015 and 2016; the number went up from 39,997 to 41,558 (CDC; NCHS ID 611012)
- The highest discrepancy in drug overdose deaths between men and women was seen in 2016, with 22,074 female deaths compared to 41,558 death records among men. (CDC; NCHS ID 611012)
- The number of drug overdose deaths among women increased by almost 400% between 1999 and 2016. (CDC; NCHS ID 611012)
- There was no single decrease in drug overdose deaths in the U.S. from 1999 to 2016; this applies to both genders.
Number of Drug Overdose Deaths in the U.S. from 2014 to 2016, by Age
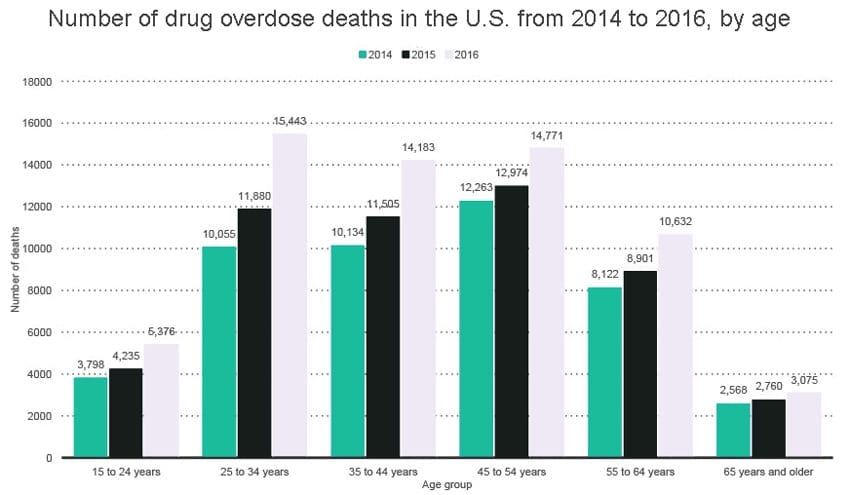
- The number of drug overdose deaths increased in all age groups in the U.S. between 2014 and 2016. (CDC; NCHS ID 611017)
- The highest number of drug overdose deaths between 2014 and 2016 was noted in groups 25 to 34 years (15,443) and 45 to 54 years (14,771). (CDC; NCHS ID 611017)
- Drug overdose deaths were not as prevalent in adolescents and elderly. However, the number of drug overdose deaths in groups 15 to 24 years was over twice as high as among people 65 and older. (6,376 compared to 3,075 in 2016). (CDC; NCHS ID 611017)
- Judging by the tendency presented in the chart, the problem of drug overdoses increases dramatically between the age of 15 and 34, with 6,376 drug overdose deaths in groups 15 to 24 years compared to 15,443 fatal cases among people in their late twenties or early thirties. (CDC; NCHS ID 611017)
- Drug overdose were relatively rare among people 65 and older when compared to the 25-34 group. Actually, their number was over 5 times lower among seniors. (CDC; NCHS ID 611017)
Number of Drug Overdose Deaths in the United States in 2015, by Drug Type
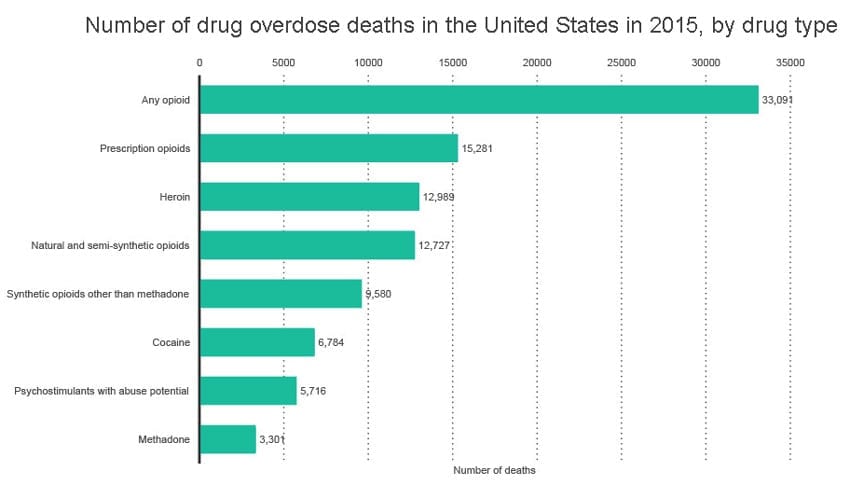
- Opioids scored the highest number of drug overdose deaths, with 33,091 of victims who overdosed on an opioid-based drug. (CDC ID 751434)
- Actually, four groups of opioids were listed among the most lethal drugs in 2015: prescription opioids (15,281 deaths), heroin (12,989 deaths), natural and semi-synthetic opioids (12,727 deaths), and synthetic opioids other than methadone (9,580 deaths). (CDC ID 751434)
- The lowest number of drug overdose deaths was seen among Methadone users, with 3,301 fatal overdoses. (CDC ID 751434)
- Unsurprisingly, there was no record of a cannabis overdose death. (CDC ID 751434)
Rate of Drug Overdose Deaths in the United States in 2015, by Drug Type (per 100,000 population)
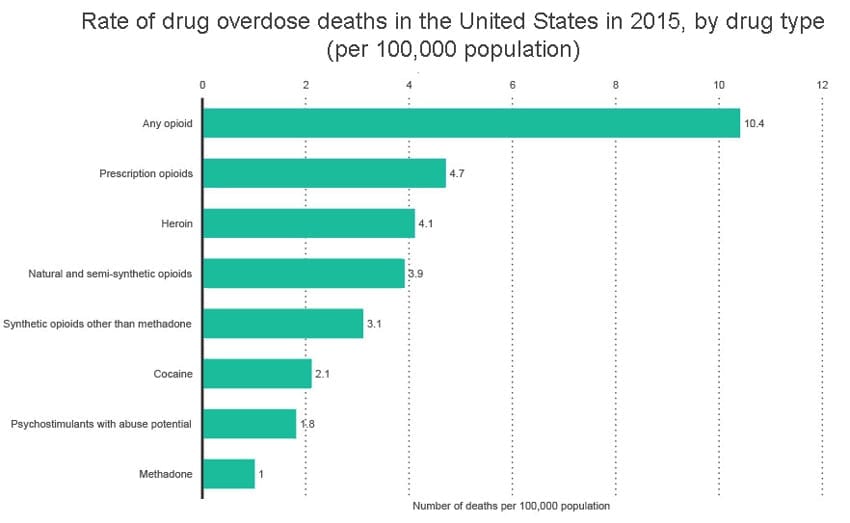
- Again, opioids were the most prevalent drugs in 2015 when it comes to fatal overdoses, with 4 deaths per 100,000 population. (CDC ID 751469)
- Prescription opioids (4.7 per 100,000) and heroin (4.1 per 100,000) had the highest rate of drug overdose deaths among all opioid-based drugs. (CDC ID 751469)
- Heroin caused almost twice as much fatal overdoses as cocaine and psychostimulants with abuse potential. (CDC ID 751469)
- Methadone scored the lowest rate of all drug overdose deaths (1 per 100,000). (CDC ID 751469)
Number of Drug Overdose Deaths Among Those Aged 15 to 24 Years in the U.S. from 1999 to 2016
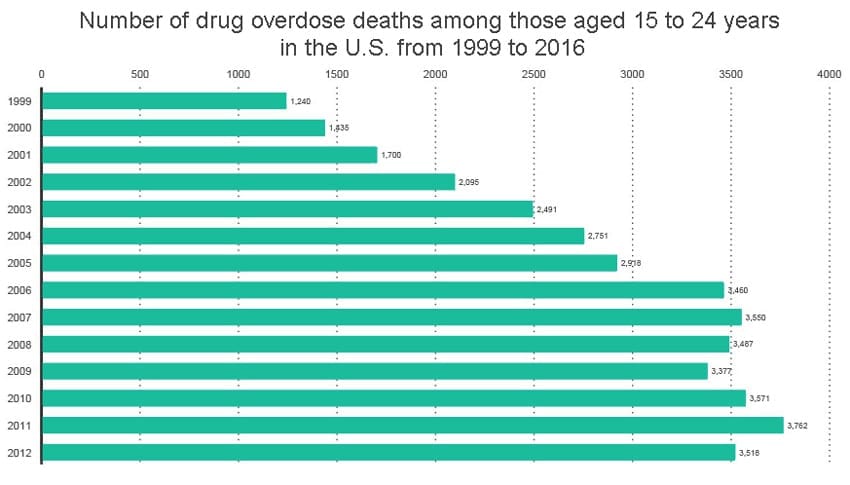
- The number of drug overdose deaths among those aged 15 to 24 years in the U.S. has been steadily increasing since 1999. In 2004, the number almost doubled. (CDC; NCHS ID 707323)
- As of 2016, we could see 5,376 fatal drug overdoses. This is over 4 times as much as in 1999. (CDC; NCHS ID 707323)
- There was a slight decrease in fatal drug overdoses between 2007 and 2009, when the number dropped from 3,550 to 3,377. (CDC; NCHS ID 707323)
Heroin Overdose Death Rate in the United States in 2016, by State (per 100,000 population)
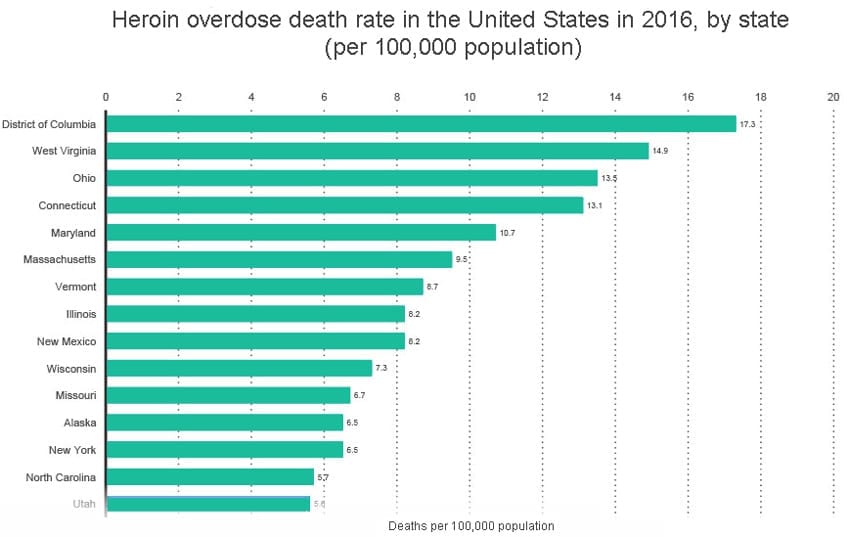
- District of Columbia had the highest heroin overdose rate of all 50 states, with 3 deaths per 100,000. (CDC ID 796939)
- West Virginia (14.9 per 100,000), Ohio (13.5 per 100,000), Connecticut (13.1 per 100,000), and Maryland (10.7 per 100,000) are also at the forefront. Maryland is the last state with the rate of fatal heroin overdoses above 10 deaths per 100,000. (CDC ID 796939)
- Oklahoma, Iowa, and Texas are among the least affected states. The heroin overdose death rate varies between 1.4 (Oklahoma) and 1.9 (Texas). (CDC ID 796939)
Treatment & Rehab

Number of Substance Abuse Treatment Facilities in the U.S. as of 2016, by State
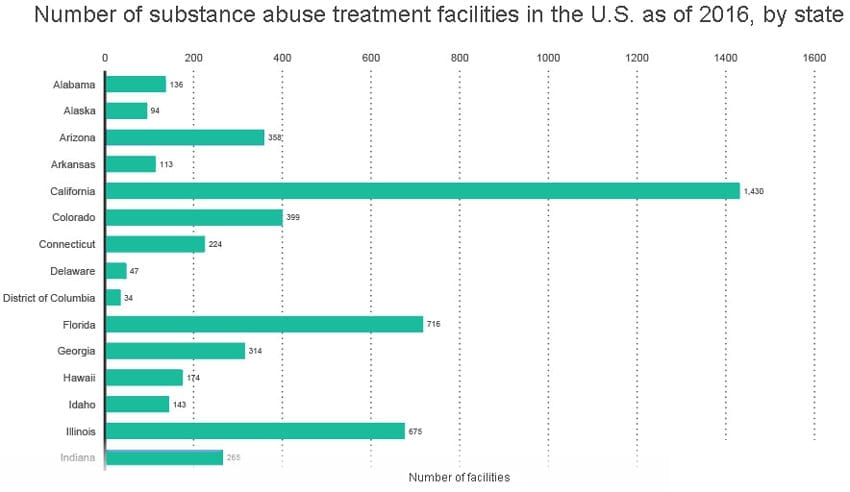
- There were 1,430 substance abuse treatment facilities in California in 2016. (SAMHSA ID 462615)
- Florida scored the second place with 715 such facilities, two times fewer than California. (SAMHSA ID 462615)
- Delaware and District of Columbia had the lowest number of substance abuse treatment facilities in the United States. There were only 47 facilities in Delaware and 34 in D.C. Interestingly, District of Columbia has the highest rate of heroin abuse and overdose death rates of all 50 states. (SAMHSA ID 462615)
Number of Substance Abuse Treatment Clients in the U.S. as of 2016, by State
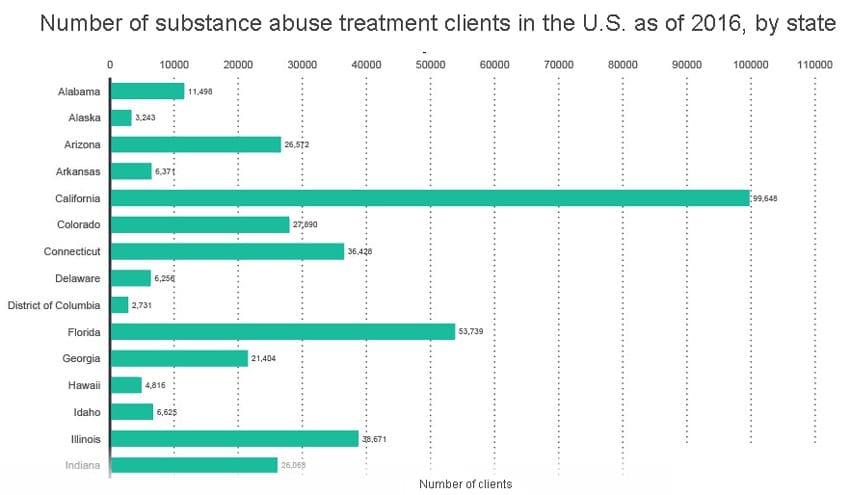
- As of 2016, 99,648 clients attended California substance abuse treatment facilities, which is almost two times more than in Florida. (SAMHSA ID 452626)
- The list of states with the lowest number of substance abuse treatment clients include District of Columbia (2,731), Alaska (3,243), Hawaii (4,816), and Idaho (6,625). (SAMHSA ID 452626)
- California had more substance abuse treatment clients than Colorado, Arizona, and Illinois all together. (SAMHSA ID 452626)
Total Number of Substance Abuse Treatment Facilities in the U.S. from 2003 to 2016
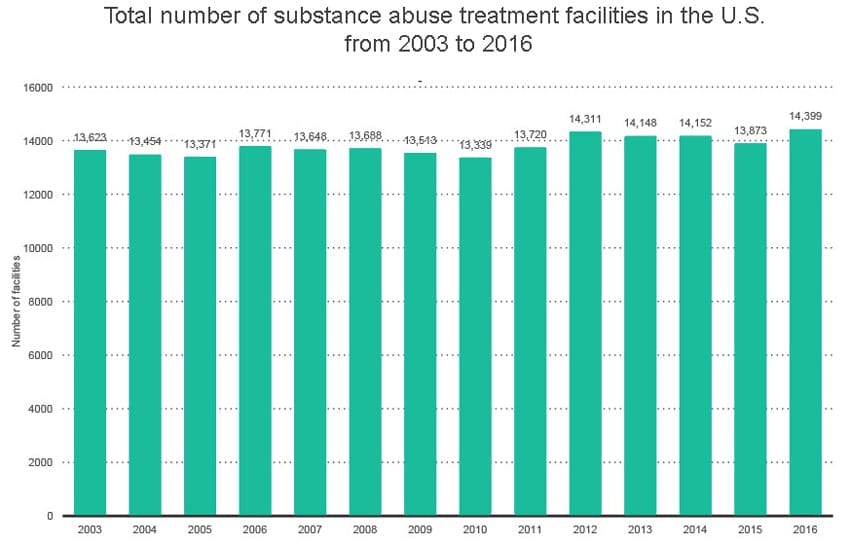
- There were 13,623 substance abuse treatment facilities in the U.S. as of 2003. (SAMHSA ID 450281)
- The number of substance abuse treatment facilities increased by 767 between 2003 and 2016 with 14,399 such clinics in the whole country. (SAMHSA ID 450281)
- 2009 was the year with the lowest number of substance abuse treatment facilities in the United States. Drug recovery statistics from show that there were 13,339 such facilities in the country, which is 284 fewer than in 2003. (SAMHSA ID 450281)
Distribution of Substance Abuse Treatment Facilities in the U.S. as of 2016, by Operation Type
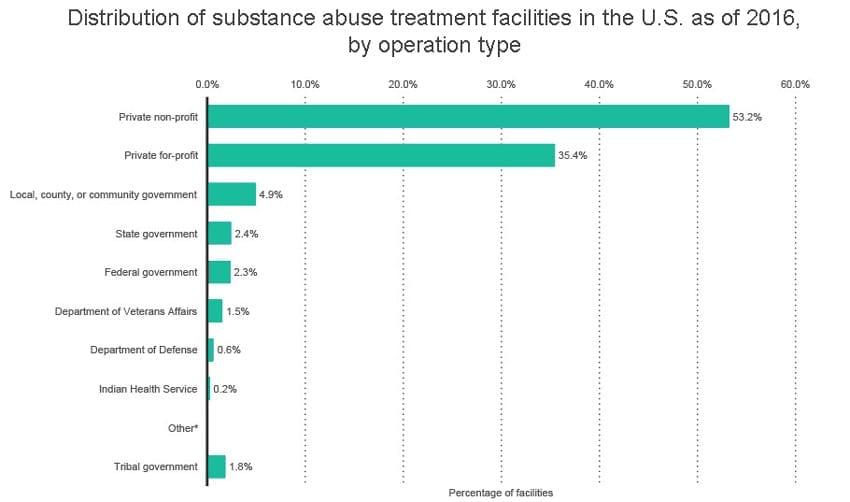
- Private substance abuse treatment facilities made up 6% of all such institutions in 2016. (SAMHSA ID 452477)
- Private non-profit treatment facilities were the most prevalent in the U.S. They made up 2% of all substance abuse treatment facilities. (SAMHSA ID 452477)
- Private for-profit treatment institutions scored the second place, with 4% of the total share. (SAMHSA ID 452477)
- There was a large discrepancy between the number of government-run and private substance abuse treatment facilities. Federal government facilities made up 2.3% of the total share. It’s a 50.9% difference when compared to private non-profit substance abuse treatment clinics. (SAMHSA ID 452477)
- Veterans are a seriously neglected group when it comes to the number substance abuse treatment facilities. Such institutions run by Department of Veteran Affairs made up only 1.5% of the total share. (SAMHSA ID 452477)
- Only 2% of substance abuse treatment facilities were run by Indian Health Service. (SAMHSA ID 452477)
Distribution of Substance Abuse Treatment Facilities in the U.S. as of 2016, by Type of Care Offered
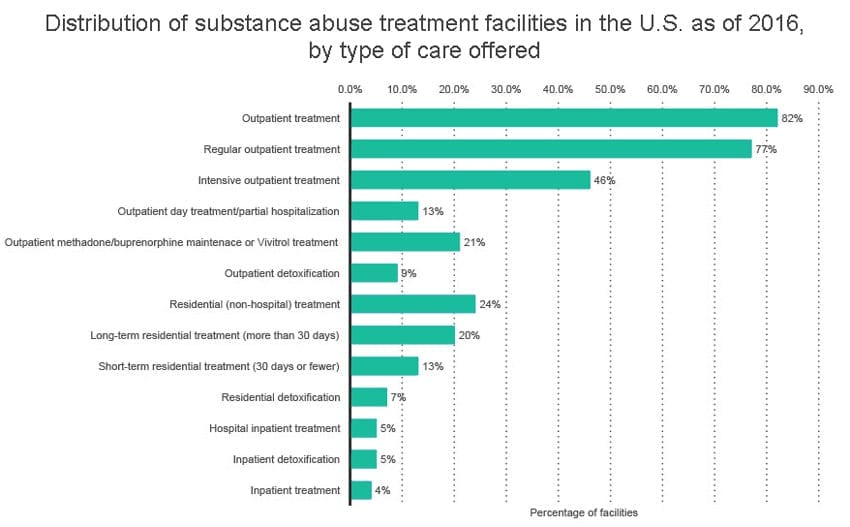
- The majority of substance abuse treatment facilities offer outpatient treatment (82%). (SAMHSA ID 452485)
- 77% substance abuse treatment facilities offer regular outpatient treatment, while 46% have an intensive treatment care. (SAMHSA ID 452485)
- 13% of substance abuse outpatient treatment facilities in the U.S. offer partial hospitalization. (SAMHSA ID 452485)
- Inpatient treatment, detoxification, and hospital inpatient treatment are the least popular services offered by substance abuse treatment facilities. Only 5% of all such institutions offer inpatient detoxification and hospital inpatient treatment, while the regular inpatient treatment is offered by 4% of substance abuse treatment facilities. (SAMHSA ID 452485)
- 21% of substance abuse treatment facilities offer treatments reserved exclusively for methadone/buprenorphine and Vivitrol addicts.(SAMHSA ID 452485)
Federal Drug Control Spending on Treatment and Prevention in the United States from 2008 to 2018 (in million U.S. dollars)
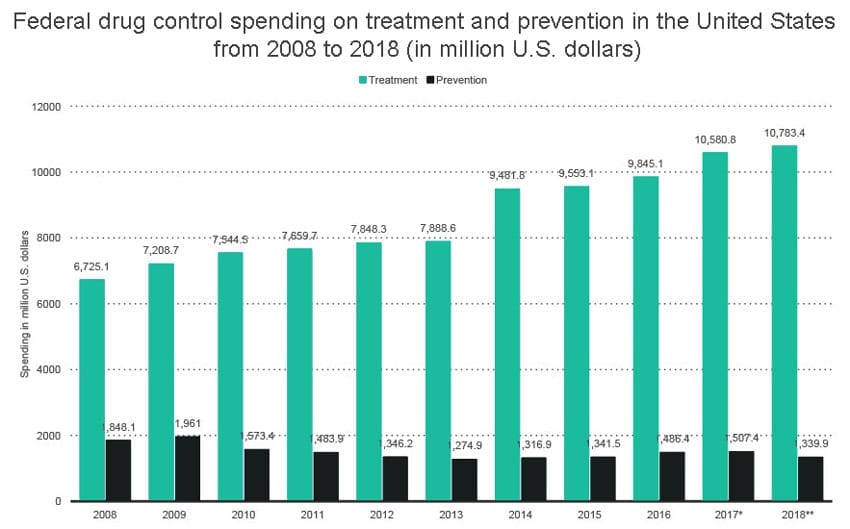
- The U.S. government spent over 7 billion dollars on substance abuse treatment. At the same time, only 339.9 million dollars were spent on prevention. (ONDCP ID 619031)
- Federal drug control spendings on treatment increased by 4.058 billion dollars between 2008 and 2018. (ONDCP ID 619031)
- In the same eight-year period, federal drug control spendings on prevention dropped by 1.50 billion dollars. (ONDCP ID 619031)
Economic Numbers
Costs Due to Abuse of Tobacco, Alcohol. Illicit Drugs, and Prescription Opioids in the United States as of 2017
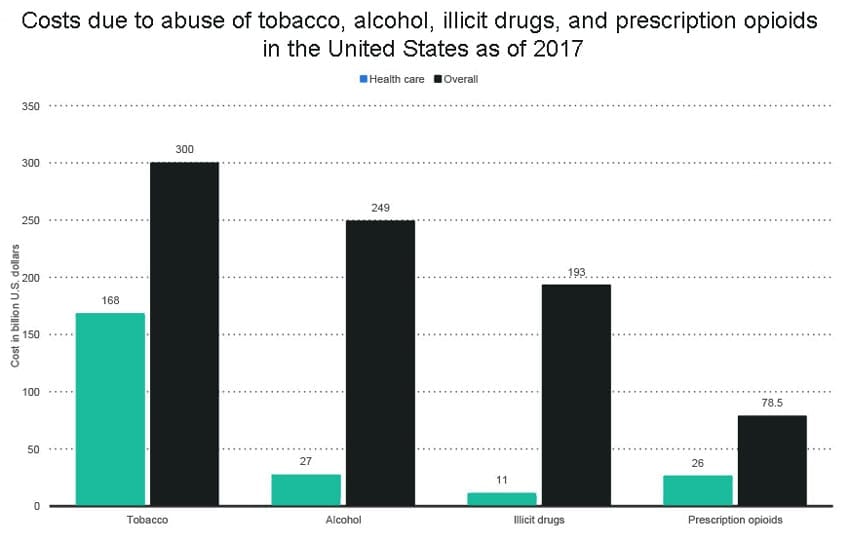
- S. Government spent 300 billion dollars due to abuse of tobacco. 168 billion dollars were spent on healthcare treatment, which is more than a half of the overall spendings. (NIDA ID 367863)
- Alcohol scored the second place, with 249 billion dollars of Government’s costs and 27 billion spent on healthcare for those who abuse alcohol. (NIDA ID 367863)
- Prescription opioids turned out to be the least expensive for the U.S. Government. Federal authorities spent 78.5 billion dollars to fight the opioid abuse. One-third of these spendings were transferred to healthcare services for opioid addicts. (NIDA ID 367863)
Illicit drugs generated the fewest healthcare costs (27 billion dollars). (NIDA ID 367863)
Percentage of U.S. Population With Usage of Prescription Drugs Within the Past Month Between 1988 and 2014, by Age
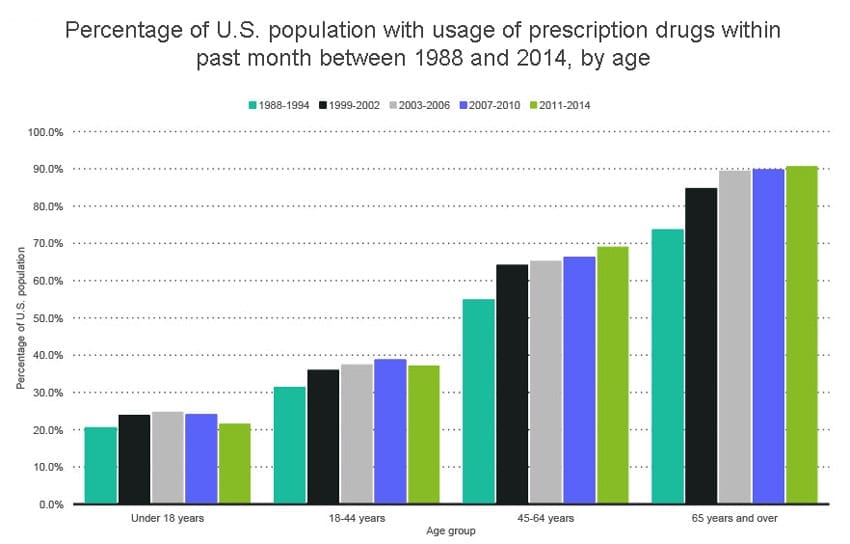
- Over 20% of people aged 18 and younger used a prescription drug in the past month between 1988 and 1994. The highest percentage of prescription drug users among this age group was noted between 2003 and 2006. (CDC; NCHS ID 184442)
- The older we are, the more often we turn to prescription drugs for relief. As of the period between 2011 and 2014, 20% of people aged 18 and younger used a prescription drug in the past month compared to 90% of those 65 and older. (CDC; NCHS ID 184442)
- Apart from people aged 18 and younger, each of the examined age group noted a steady increase in the number of prescription drug users. Again, the highest increase was scored by those 65 and older – the number grew by 20% between 1988 and 2014. (CDC; NCHS ID 184442)
Percentage of U.S. Residents that Self-reported Illicit Drug Use Within the Past Month from 2003 to 2014, by Metropolitan Size
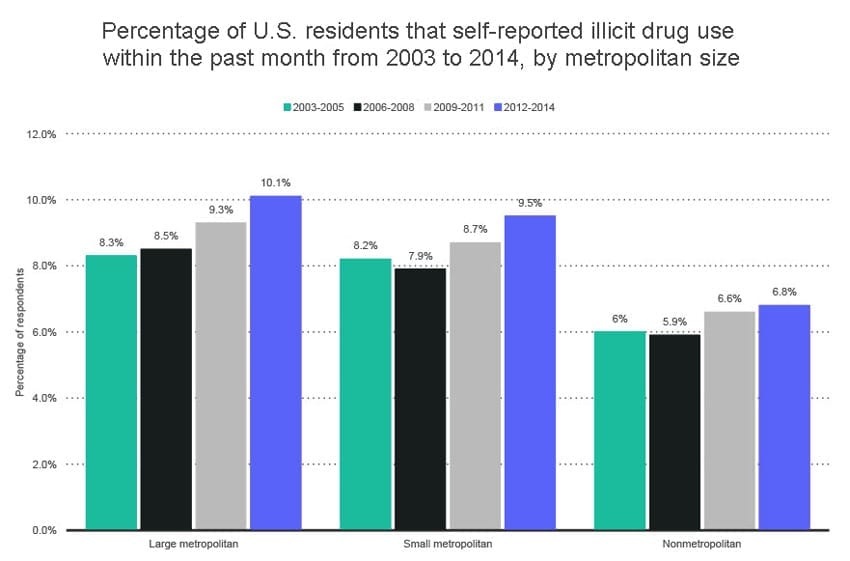
- 1% of U.S. residents self-reported illicit drug use within the past month between 2012 and 2014 in large metropolitan areas. It’s a 1.8% increase from the 2003-2005 period. (CDC; NSDUH; MMWR ID 804105)
- Small metropolitan areas are dealing with a very similar scale of illicit drug use. 5% of respondents admitted having used an illicit drug in the past 30 days in the 2012-2014 period, which is only 0.6% fewer than those who live in large metropolitan regions. (CDC; NSDUH; MMWR ID 804105)
- The use of illicit drugs is the least prevalent problem in nonmetropolitan regions, with 9% of residents admitting to having used the drug within the past month between 2012 and 2014. (CDC; NSDUH; MMWR ID 804105)
- Moreover, nonmetropolitan areas recorded the lowest increase in illicit drug users who took an illicit drug within the past month. The number grew by merely 0.8% from 2003 to 2014. (CDC; NSDUH; MMWR ID 804105)
Total Production of Cocaine in the U.S. from 2009 to 2015 (in kilograms)
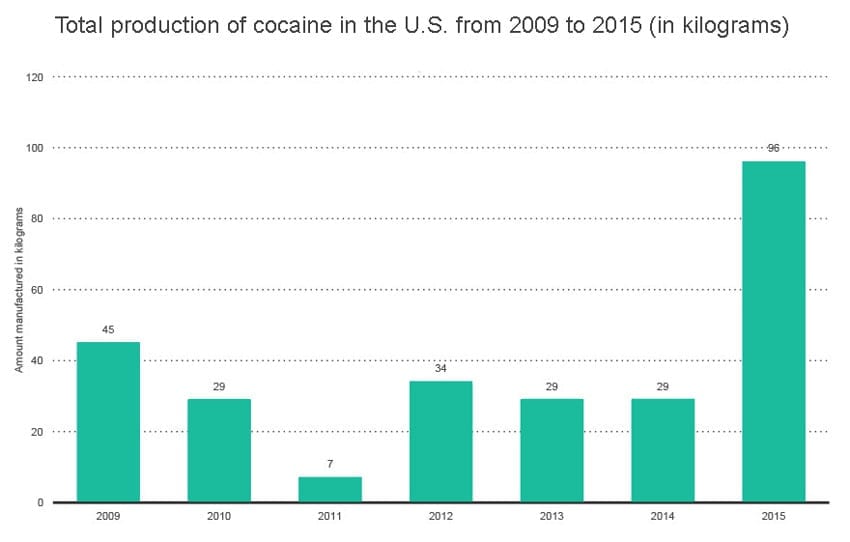
- The amount of cocaine produced in the U.S. increased from 45 kg (2009) to 98 kg (2015).
- The lowest rate of cocaine production was seen in 2011, where only 7kg of cocaine was manufactured in the country.
The production of cocaine in the U.S. increased 14 times from 2011 to 2015. - Although cocaine production was steadily decreasing from 2012 to 2014, it skyrocketed in 2015, reaching 98 kg.
Illicit Drug Use Disorder Among Adults in the United States as of 2016, by Level of Mental Illness
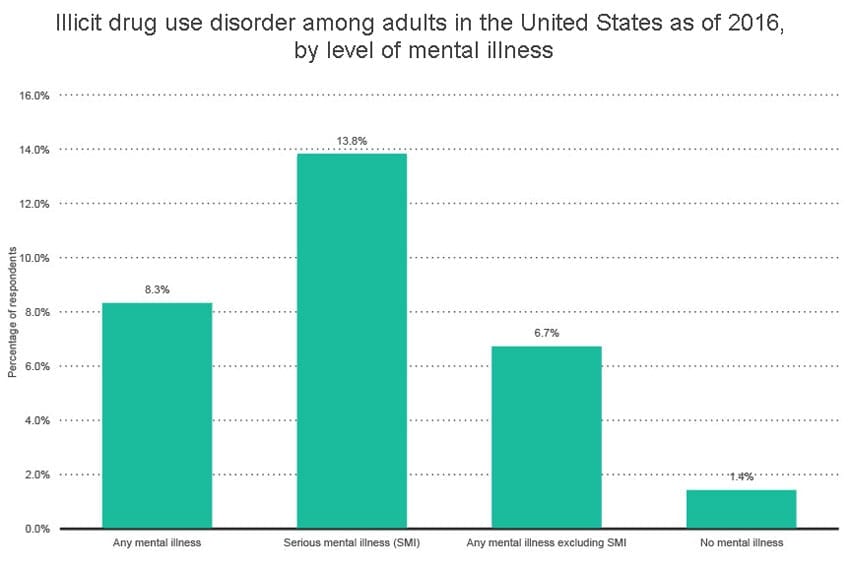
- 8% of respondents who suffered from a serious mental illness (SMI) reported that they struggled with a drug use disorder.
- Those who didn’t suffer from SMI were twice as less likely to abuse drugs as people struggling with a serious mental illness
- The lowest percentage of drug use disorders was seen among people who were mentally healthy. Only 4% of the respondents struggled with a drug use disorder.
Suicide Thoughts, Plans and Attempts Among U.S. Adults as of 2016, by Substance Dependence or Abuse
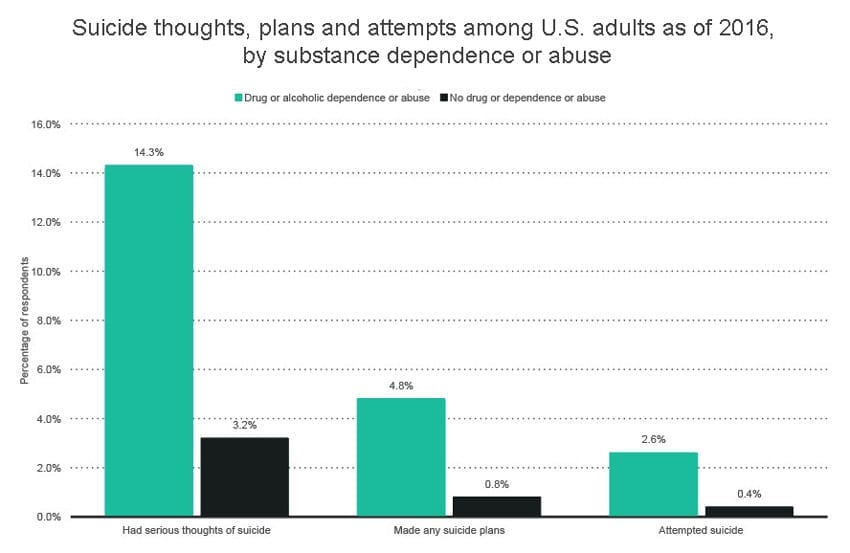
- 3% of U.S. adults who were dependent on drugs or alcohol, or abused them, had serious thoughts of suicide. At the same time, only 3.2% of respondents with no drug dependence or abuse experienced such thoughts. (SAMHSA; NSDUH ID 252478)
- 8% of adult Americans with a diagnosed drug dependence or abuse made suicide plans in 2016. Again, the percentage of individuals who made suicide plans among dependance-free respondents was significantly lower (0.8%) (SAMHSA; NSDUH ID 252478)
- Of all respondents who were drug or alcohol dependent, 2.6% attempted suicide, with only4% of dependence-free individuals trying to kill themselves. (SAMHSA; NSDUH ID 252478)
Total Federal Drug Control Spending in the United States from FY 2013 to FY 2018 (in millions of U.S. dollars)
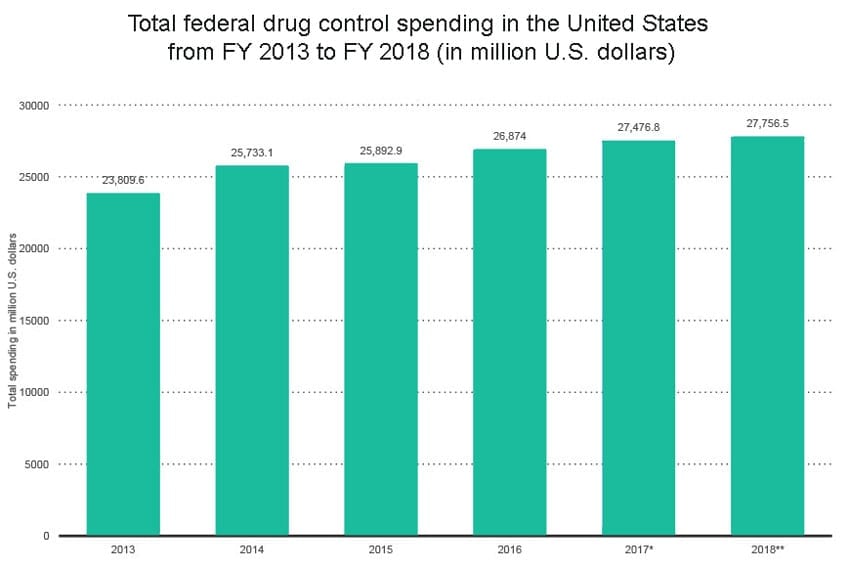
- This year, the Federal Government has already spent 27,7 million dollars on drug control, which is 3 million dollars more than in the past year. (ONDCP ID 618857)
- Since 2013, Federal drug control spendings in the United States increased by 3.8 million dollars. (ONDCP ID 618857)
- The amount of money spent by federal authorities on drug control were systematically increasing by an average of 1 million dollars in the 2015-2017 period. (ONDCP ID 618857)
- There was no single drop in federal drug control spendings over the past 5 years. (ONDCP ID 618857)